|
|
|
![]()
Some
features of the East Indian experience in the Caribbean may very well add up
to a profile in historical marginalization. These features include dislocation
from India, massive burden of labor in the Caribbean, ethnic victimization in
the post-colonial era, and migration to the metropolitan centers. Such
characteristics generate a double marginalization, as Naipaul would say (Birbalsingh).
First, there is marginalization via their relationship to a subservient
American and Euro-centered Creole-Caribbean condition. Second, there is
marginalization via their ‘outsider’ status as East Indians in the
Caribbean.
However,
the main focus here is on samples of social marginalization of East Indians
during PNC rule. Social marginalization depicts a group that is not allowed to
participate fully in the institutions of the dominant society through
prejudice and discrimination. In this case, their marginality is mainly
experienced through their participation levels in the occupational structures.
Limiting
ethnic participation
The
following is what Mr. Burnham had to say about national unity in 1971. “When
I described 1971 as the year of national unity…I meant the active
involvement of the overwhelming number of Guyanese in our national goals and
aims.” However, Guyana’s serious economic failures and a developing
authoritarianism under the PNC dramatically curtailed active participation by
all working-class Guyanese in building national unity. A few economic failures
and some elements of an emergent dictatorship are now presented:
The
7-year Development Plan (1966-1972) buckled in 1969.
The
‘Feed, House and Clothe the Nation’ Development Plan remained a catchword
without producing substance.
The
Third Development Plan (1978-81) increased the debt burden accompanied by
little or no industrialization.
Hoyte
claimed in 1981 that the economy ‘was disastrous’, and the New Nation
noted that the economy was ‘tottering on the brink of collapse’.
Rigged
elections continued to be the norm.
The
militarization of Guyana was enhanced with about one military personnel for
every 35 citizens.
The
women’s section of the PNC proposed a one-party state for Guyana in 1971.
High
real interest rate and high inflation led to declining productive investments
and transformed the economy into speculative and trade dealings.
Currency
devaluation from G$4.15=US$1 in 1985 to G$126=US$1 in
1992.
Norman
Semple of the Guyana Public Service Association talked about ‘a crisis of
authority’ induced by ‘a blurring of the line of authority between
political and administrative decision making’, creating a problem
in’…the efficiency of the administrative machinery of the state…’
Decline
in the East Indian student population at the University of Guyana possibly
correlated with the operations of the National Service.
Perceptions
that acquisition of significant jobs is related to holding a PNC membership
card abounded.
My interpretations and discussion on ethnic participation in the State Sector
are based on the findings of Debiprashad and Budhram’s study of East Indians
in the Caribbean, published in the 1980s. How did East Indians and Africans
fare under the PNC when it came to active participation in the public sector?
Agriculture
In
agriculture, the data from six crops showed that more than 70% were East
Indian operators. The crops were rice, sugar, coconuts, green vegetables,
citrus, and pineapples. East Indians, according to the researchers, clearly
contributed the most positive role in agricultural transformation of the
economy.
East
Indians in their rural habitat provided an important food basket for Guyana at
a time when the slogan ‘feed, clothe, and house’ the nation became a catch
phrase. Later, the phrase remained a mere slogan.
After
1964, East Indians experienced declining guaranteed prices for rice purchased
by the Rice marketing Board, the beginning of the fall of agriculture.
Public
Service
Table1:
Public Service-Senior Administrative and Executive Ranks
Total
Nos. EI A O % EI % A % O
Ministers
29 7 20 2 24 69 7
Other
Senior Positions 66 31 25 10 47 38 15
Permanent
Secretaries 29 2 25 2 7 86 7
Principal
Assistant Secretaries 38 14 21 3 37 55 8
Personnel
22 5 17 - 23 77 -
Accounts
19 9 8 2 47 42 11
Other
Departmental Heads 139 19 102 18 14 73 13
Source:
Debiprashad & Budhram’s East Indians in the Caribbean (1987)
EI=East
Indians; A=Africans; O=Others
In the Ministries, only a handful of East Indians occupied senior
administrative positions. Africans filled most of these posts, as evidenced in
Table 1. In 1973, there was only one East Indian Permanent Secretary compared
to two in 1979. About 37% of Principal Assistant Secretaries and only 23% of
Heads of Personnel Divisions were East Indians. There were 7 East Indian
Ministers and 20 African Ministers. Some ethnic balance is evidenced in the
Accounts Division. Africans clearly dominated positions of Other
Departmental/Divisional Heads, including Regional Development Officers.
Education
Table 2:
Ethnic Composition of Heads of Main Educational Institutions
Total Nos. EI A O % EI % A % O
Higher
Institutions of Learning 9 - 9 - - 100 -
Multilateral
Schools 5 - 4 1 - 80 20
Community
High Schools 25 5 19 1 20 76 4
Other
Secondary Schools 40 23 15 2 57.5 37.5 5
Education
Officers 20 6 14 - 30 70 -
Source:
Debiprashad & Budhram’s East Indians in the Caribbean (1987)
Table 2 shows the racial and ethnic imbalance in education during the PNC’s
ruling years. Africans headed all higher education institutions, including the
University of Guyana, Cyril Potter College of Education. No East Indian headed
the Multilateral Secondary Schools, while only five East Indians were Heads of
Community High Schools out of a total of 25.
A
serious racial imbalance of Education Officers prevailed. Out of a total of 20
Education Officers, 14 were Africans.
State
Boards
Africans
dominated the Chairmanships and memberships of State Boards, Committees, and
Commissions. There were 35 Chairmen of African origin of a total of 44
Boards/Committees/Commissions. Of a total of 487 members of
Boards/Committees/Commissions, only 97 were East Indians and 365 were
Africans.
At the
time of the study, there were 38 corporations and companies under the
jurisdiction of the Guyana State Corporation. Each corporation had a Board of
Directors and a General Manager. In a total of 270 Directors, 170 were
Africans and 53 were East Indians. General Managers numbered 24 Africans and 7
East Indians. Even among Deputy General Managers, Africans dominated, carrying
18 out of 27 positions.
This
racial and ethnic imbalance demonstrated in the 1970s and 1980s, achieved a
high level of sustainability almost throughout the PNC’s ruling years. This
is part of the PNC’s legacy of sustained ethnic imbalances in the public
sector, a legacy that has corroded the foundations of the social and economic
infrastructures of this country.
The World Bank Group Report (1994), referring to the 1988-1992 period, noted
“The government ' s capacity to deliver essential services has virtually
collapsed. Infrastructure remains severely dilapidated. The supply of potable
water is limited to a small proportion of the population, drainage and
irrigation systems have deteriorated to the point that they are no longer
useful, and health and education services have become so inadequate that
social indicators for the country have fallen to among the lowest in the
Caribbean.”
When the Opposition elements complain about the performance of the People’s Progressive Party (PPP/C) Administration, they should know that many of these infrastructures are being rebuilt. The PPP/C Administration, erroneously perceived as an East Indian Government, has not created East Indian control of the public sector, in the same way that the PNC regime concocted an African-dominated State Sector. At any rate, the sample evidence definitively indicates that East Indians were marginalized in the Public Sector during the PNC’s ruling years.
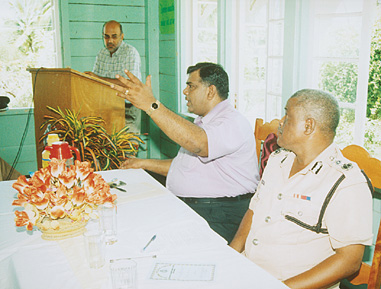
Minister Ronald Gajraj making a point during yesterday's meeting at the Cove and John Police Station.